GYRE_PISCES-eddy
Analysing results from your gyre experiments
In this page, we show some results to compare our the eddy parameterisations can alter the gyre simulations. All the plots showed in this page have been generated using a python jupyter notebook (available in the scripts folder of this repository). To run it without trouble, you will probably need to install a suite of python libraries. We thus provide a requirements.txt file in the scripts folder.
Results overview
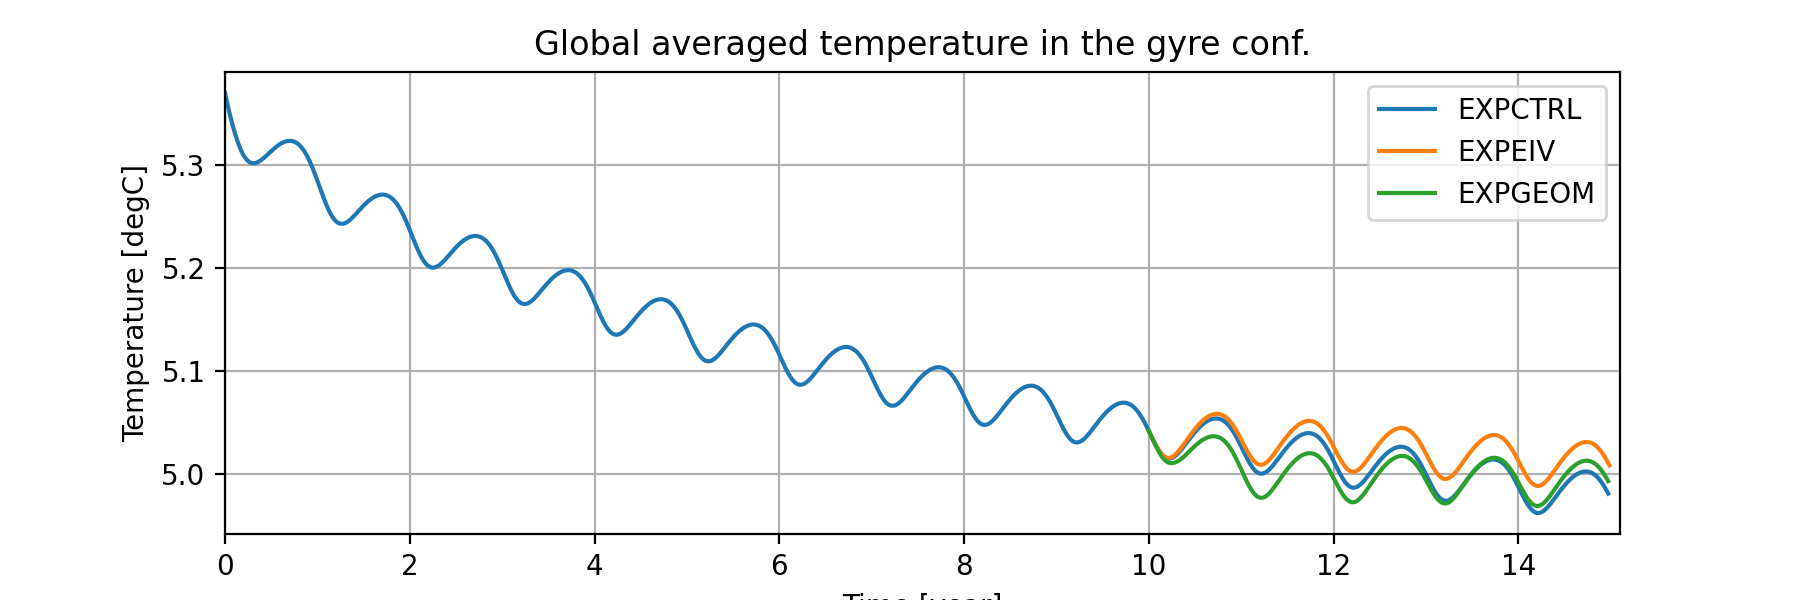 Figure: Evolution of the domain-avergaed temperature during our experiments.
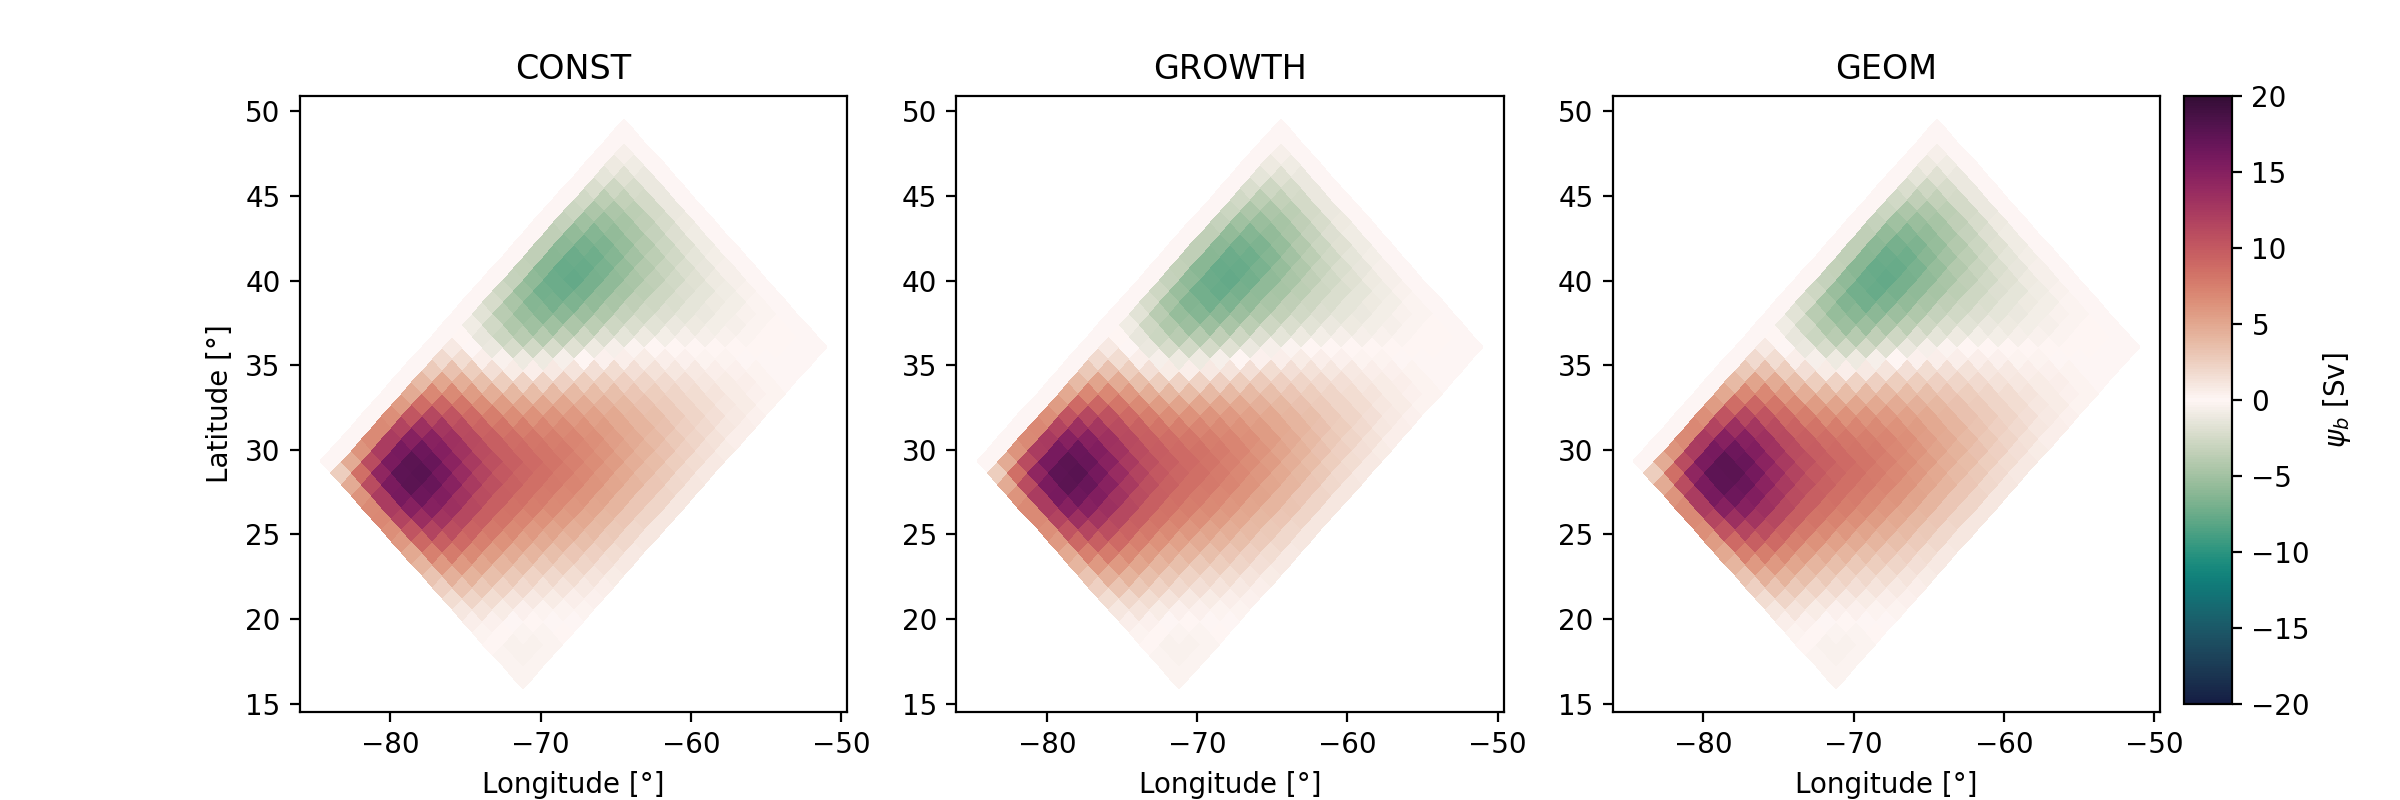 Figure: Barotropic stream function in EXPCTRL (left), EXPEIV (middle) and EXPGEOM (right).
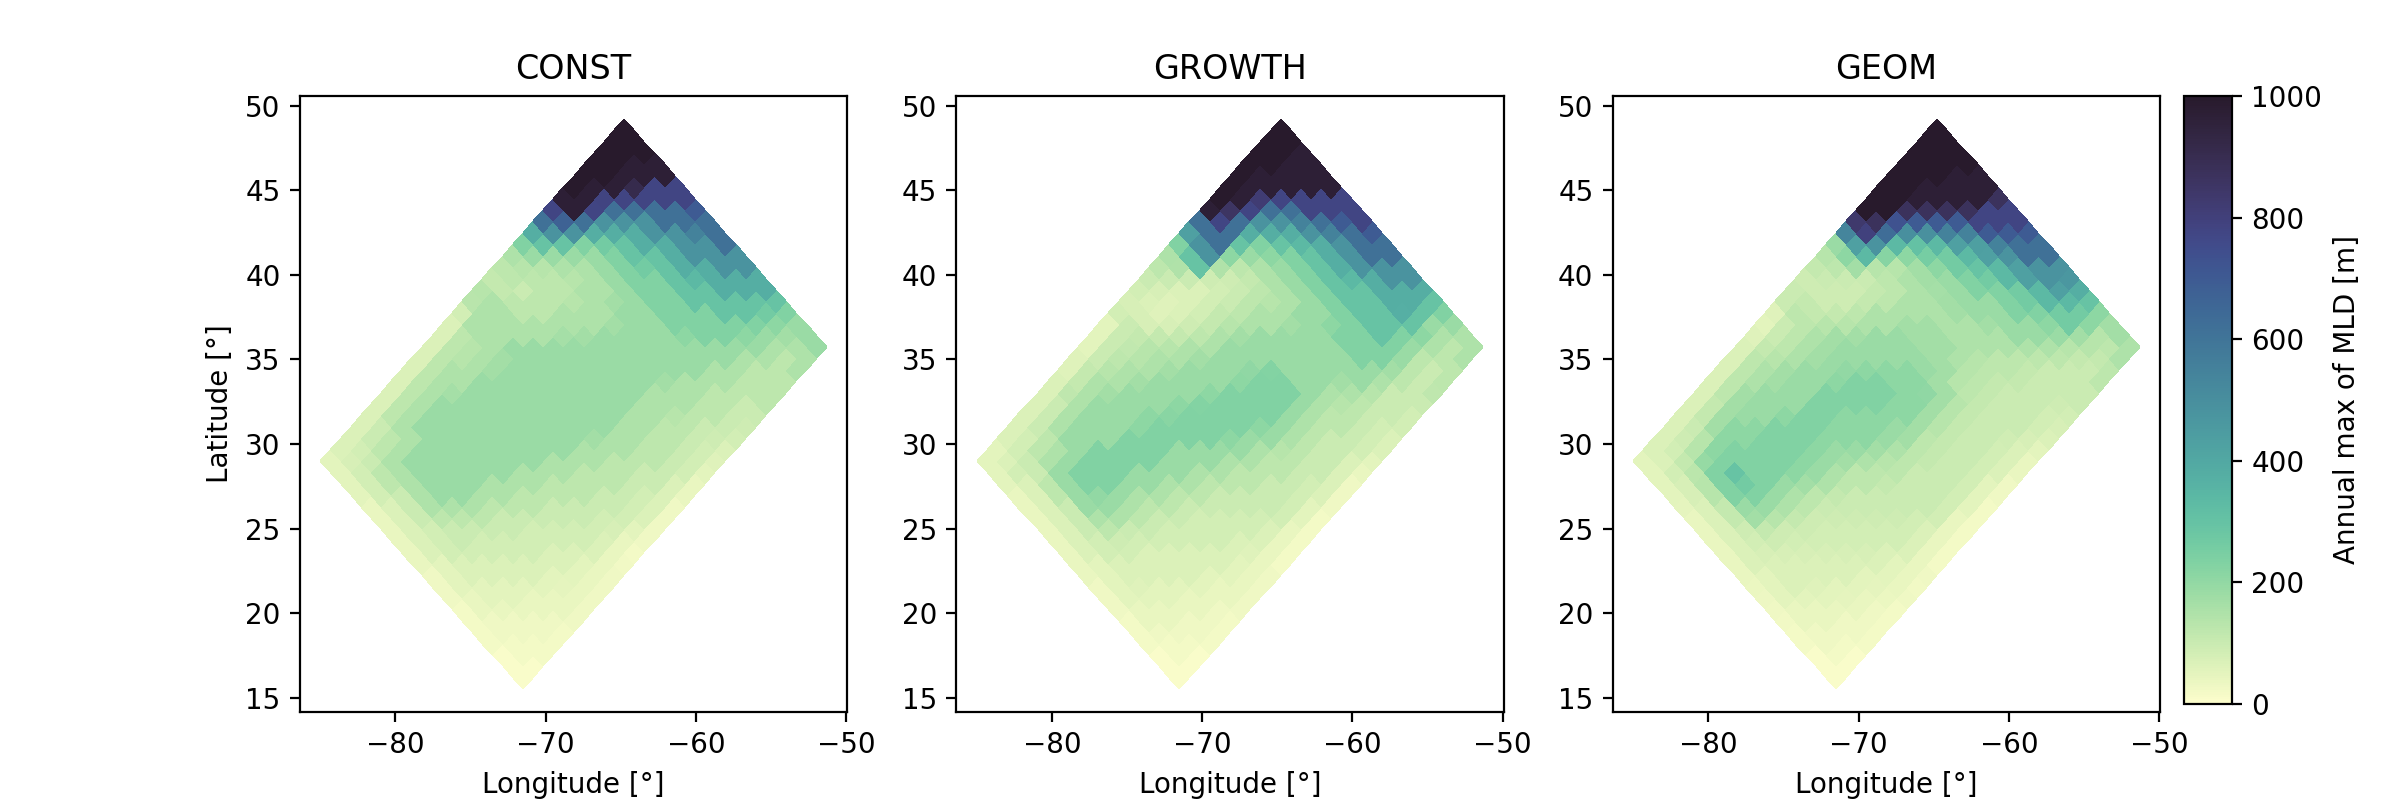 Figure: Annual maximum of the mixed layer depth (MLD) in EXPCTRL (left), EXPEIV (middle) and EXPGEOM (right).
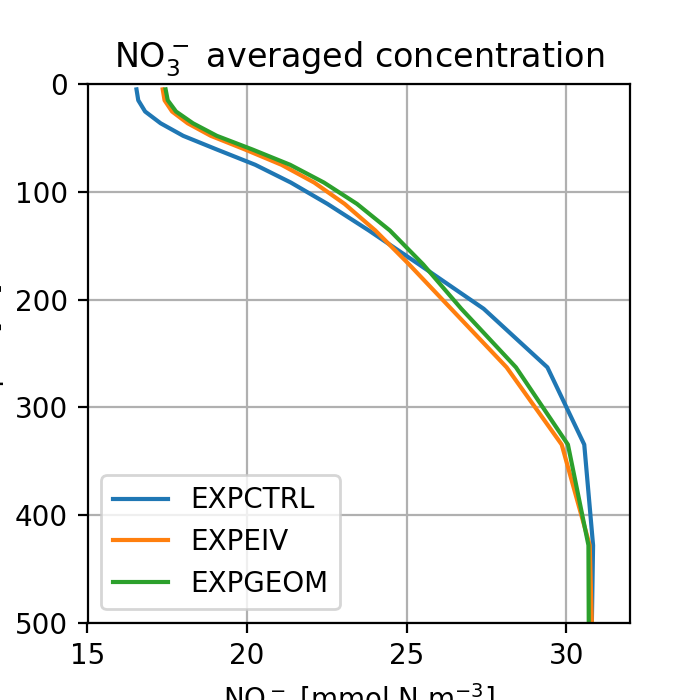
Figure: Averaged profiles of nitrogen (NO\(_3^{-1}\)) in EXPCTRL (blue), EXPEIV (orange) and EXPGEOM (green).
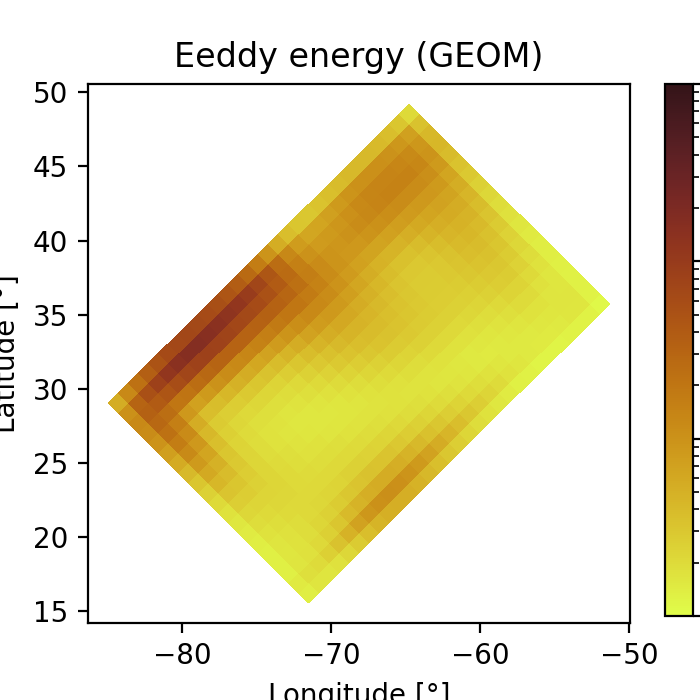
Figure: Parameterised eddy energy in EXPGEOM.
Summary
In this last page, we have shown few results from our numerical experiments that can be used to compare mesoscale parameterisation. It is worthnoting that in the gyre configuration, the circulation is mostly driven by the analytical atmospheric forcings and is therefore not really sensitive to changes in the mesoscale parameterisations. However, concentration of bio-geo-chemical matters can be altered by the parameterisations of mesoscale transport on longer timescale. in this tutorial you have learn how to set-up a numerical protocol in NEMO5 which can be used with longer simulations or other configurations.